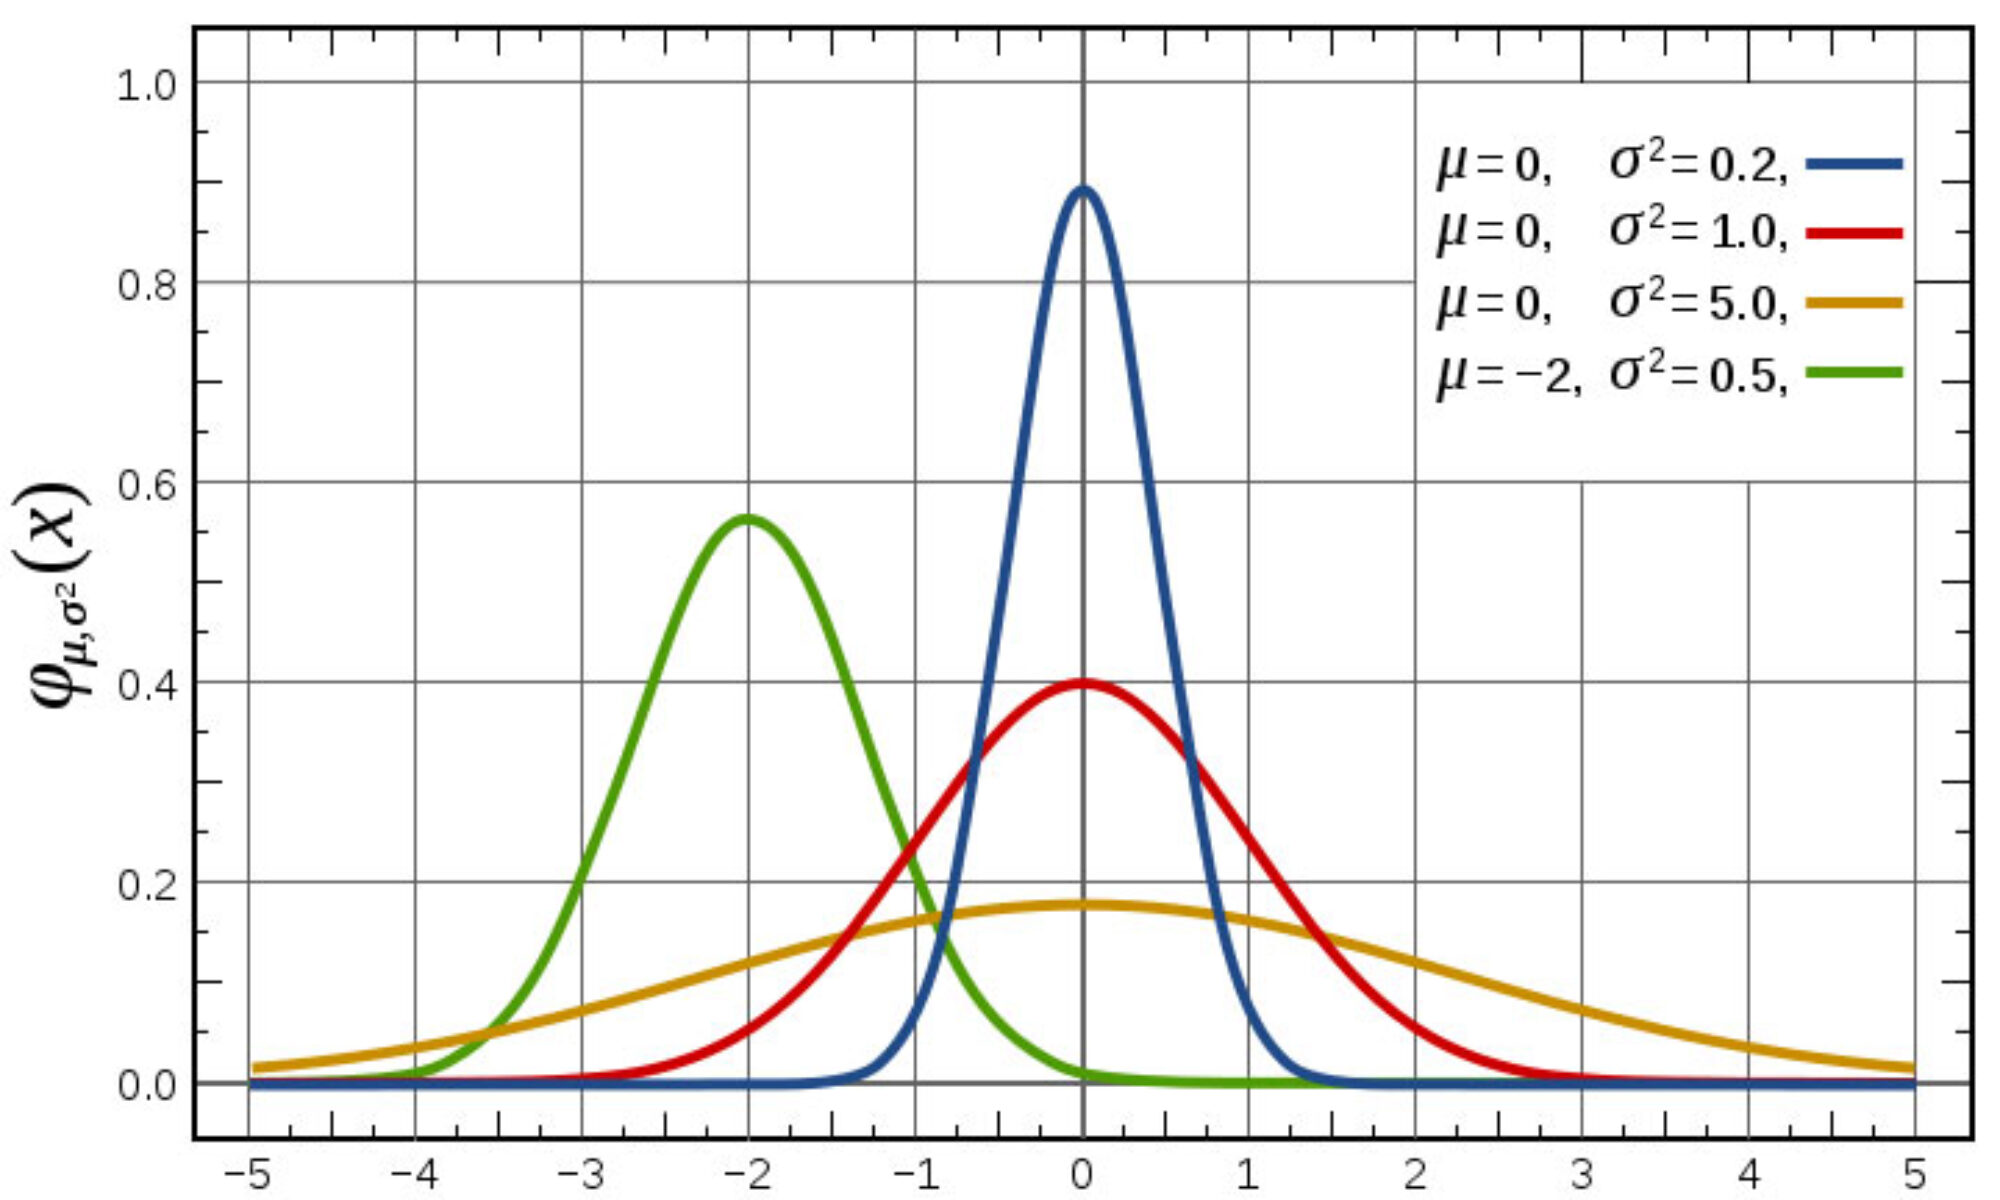
Here’s an extra credit opportunity for Finance 4366. Working on your own (i.e., this is not a group project; I will only give credit for spreadsheets that are uniquely your own), build your own “z” table in Excel (patterned after the table at http://fin4366.garven.com/stdnormal.pdf); the top row should have values ranging from 0.00 to 0.09, and the first column should have z values ranging from -3.0 to +3.0, in increments of 0.1).
Conveniently, Excel has the standard normal distribution function built right in; e.g., if you type “=normsdist(z)”, Excel returns the probability associated with whatever z value you provide. If you type “=normsdist(0)”, .5 is returned, since half of the area under the curve lies to the left of the expected value E(z) = 0. Similarly, if you type “=normsdist(1)”, then .8413 is returned because 84.13% of the area under the curve lies to the left of z = 1. Perhaps you recall from your QBA course that 68.26% of the area under the curve lies between z = -1; this “confidence interval” of +/- 1 standard deviation away from the mean (E(z)=0) is calculated in Excel with the following code: “=normsdist(1)-normsdist(-1)”, and so forth.
The grade you earn on this extra credit assignment will replace your lowest quiz grade; that is if your lowest quiz grade is lower than your extra credit grade. The deadline is the start of class on Tuesday, January 30.
You can turn your spreadsheet for this extra credit assignment in at the link labeled “Z Table Extra Credit Assignment” under the Assignment tab on Canvas.
